
- Bitcoin
- Liquidity
- Macroeconomics
- Institutional Research
21Rates editor’s note: Michael Pierre submitted this report for republication. The original PDF retains its “Restricted Distribution” cover label. This September 2026 month-end report was published October 3 and revised October 4, 2026. Its readings are historical. The report’s wording, charts, source references, and disclosures are preserved below, with tables reformatted for the web.
Read or download the original 14-page Skylark Digital Assets report (PDF).
Monthly liquidity, FLI/TLP, global cycle, funding, and crypto market review
| Measure | Reading |
|---|---|
| Reporting Period | September 2026 Month-End |
| Data Through | October 1, 2026 Monthly Open |
| Published | October 3, 2026 (revised October 4) |
| Original classification | Institutional — Restricted Distribution |
Reporting Convention: This month-end report reviews the completed September period while incorporating the first monthly-open observations available immediately after month-end, together with the latest validated weekly and market data available at publication.
1. Executive Summary
REGIME QUESTION
October's liquidity picture leaves two plausible paths: a rollover from an unusually choppy cycle, or an extended cycle in which repeated corrections interrupt expansion without producing a full reset. Monthly FLP remains Transitional at 58.13, while the TLP composite is 54.48 and its standardized reading is -0.8242. The weakening monthly impulse warrants caution, but continued FLI growth and a GBC reading in Expansion preserve the second scenario. The present signal is therefore tension rather than resolution: structural support remains intact while momentum has softened.
WHY THE CYCLE MAY BE STRETCHING
The extension case rests on overlapping disruptions since 2020: pandemic shutdowns and reopening, extraordinary fiscal and monetary support, supply-chain dislocation, inflation and rapid tightening, wars in Ukraine and Iran, energy and tariff shocks, and accelerating AI investment. These forces can distort the timing of a conventional liquidity cycle without eliminating cyclicality. GEPUCURRENT reached 620.88 in April 2025 and stood at 241.69 in July 2026 [1], illustrating unusually intense policy-uncertainty episodes. That supports a regime of repeated disruption; it does not, by itself, prove that the expansion must last longer.
TRANSMISSION, FISCAL CUSHION AND THE 2022 PRECEDENT
One plausible mechanism is delayed transmission. Borrowers with longer-term fixed-rate funding can remain insulated from higher rates until refinancing becomes necessary, while fiscal flows can sustain demand through private-sector weakness. In 2022, contemporaneous BEA releases showed two quarterly real-GDP declines [2], yet the NBER did not designate a recession. Federal outlays equaled 25.1% of GDP and the deficit 5.5% in fiscal 2022 [3]. Those figures establish substantial fiscal involvement, not an otherwise-certain recession counterfactual. NBER weighs depth, diffusion and duration rather than applying a two-quarter GDP rule [4].
AI INVESTMENT AND CAPITAL CONSTRAINTS
AI adds another potential source of persistence. Strategic competition encourages continued investment in compute, power, networking, autonomous systems, robotics and agentic software. Announced infrastructure programs support the possibility of a multiyear buildout [5], although deployment schedules and eventual returns remain uncertain. An enduring technology transition can still coexist with sharp financial repricing as competing claims on capital, electricity and productive capacity raise funding costs.
WORKING INTERPRETATION / TEST
Skylark's working interpretation is that policy responsiveness, fiscal support, delayed debt repricing and strategic investment could prolong the cycle despite recurring instability. The case strengthens if FLP and TLP stabilize while credit remains available and business-cycle activity holds up; it weakens if deterioration becomes broad and persistent, refinancing pressure intensifies, or investment commitments retreat. An extended cycle could include sizeable but relatively brief corrections and an FLP recovery before a return to the low-40s reset area, but that remains a scenario to test - not a demonstrated floor under FLP or asset prices. Inflation and sovereign-financing constraints can still delay or limit policy support.
1.1 Key Intelligence
Key intelligence for September 2026 month-end
Monthly FLP score of 58.13 indicates a Transitional liquidity regime (9 monthly observations; 244 elapsed calendar days from the Feb. 1 regime start through publication).
Weekly FLP is 56.412 in a Transitional regime, with a +0.265 point 1-week change and -5.637 point 13-week change.
3-month Monthly FLP delta: -9.02% (-5.76 points).
Monthly FLI 4,834,013.10 (+3.09% 3M) / Weekly FLI 9,189.50 (+10.80% 13W).
TLP Z-score -0.8242 (3M change -0.7301) / TLP Composite 54.48.
GBC 56.54 [Expansion].
Global Funding Conditions: all four assets in Expansion; no active forward-spread blowout signals.
BTC at $83,635.35 / ETH at $2,683.92 / Est. BTC TX Vol: $7.53B.
Bitcoin Network Regime: 56 / Neutral; 2 active stress flags.
Network snapshot: October 4; GFC source week: September 27.
2. Liquidity
Published monthly and weekly liquidity regime views
Published Monthly FLP
| Measure | Reading |
|---|---|
| Monthly FLP score | 58.13 |
| Regime | Transitional |
| Latest data date | 2026-10-01 |
| Data status | Healthy |
| 1-month point change | -2.79 |
| 3-month point change | -5.76 |
| 3-month % change | -9.02% |
| Days in regime (as of publication) | 244 |
| Distance to next threshold | 6.87 |
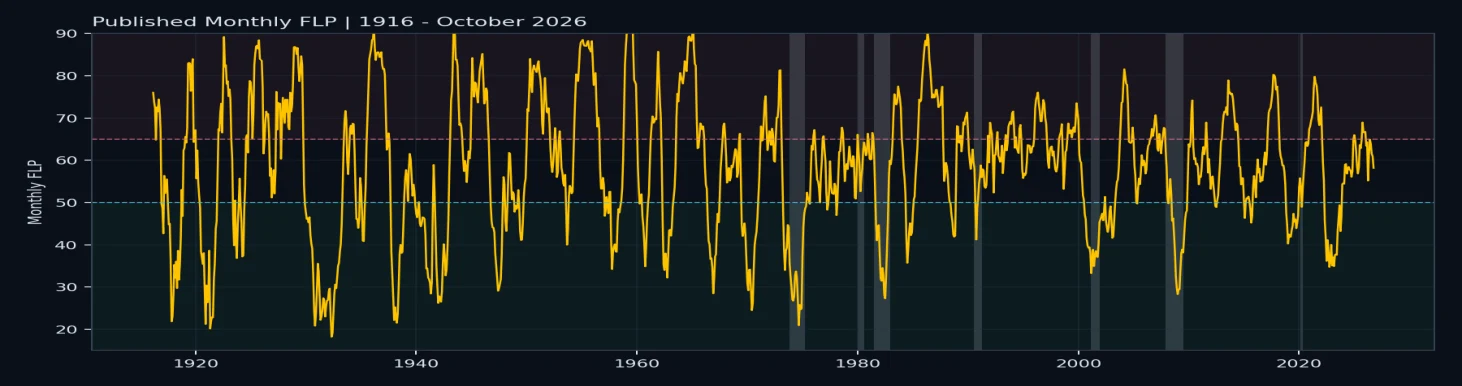
Monthly FLP is the published, locked monthly regime reading derived from the canonical monthly series. It reflects finalized monthly FLP values and does not update intra-month. The current Transitional run began on 2026-02-01; the 244-day duration is measured through the 2026-10-03 publication date. The regime classification is canonical: Favorable when FLP is below 50, Transitional when FLP is greater than or equal to 50 and below 65, and Defensive when FLP is greater than or equal to 65.
Weekly FLP Summary
Higher-resolution tactical liquidity regime view
| Measure | Reading |
|---|---|
| Weekly FLP | 56.412 |
| Regime | Transitional |
| Latest week | 2026-09-27 |
| 1-week point change | +0.265 |
| 13-week point change | -5.637 |
| 13-week % change | -9.08% |
Financial Liquidity Index Summary
Monthly and Weekly FLI
| Measure | Reading |
|---|---|
| Monthly FLI | 4,834,013.10 |
| Monthly date | 2026-10-01 |
| Monthly 1M point change | +38,996 |
| Monthly 3M point change | +144,858 |
| Monthly 3M % change | +3.09% |
| Weekly FLI | 9,189.50 |
| Weekly date | 2026-09-27 |
| Weekly 1W point change | +58.60 |
| Weekly 13W point change | +896.00 |
| Weekly 13W % change | +10.80% |
Monthly FLI provides the structural liquidity-index view, while Weekly FLI provides the higher-resolution tactical liquidity-index view. Both readings use the published FLI series.
2.1 Monthly FLP Historical Chart
Long-term published FLP context with recession overlays
2.2 Liquidity — FLP vs Bitcoin
Monthly and weekly published FLP with Bitcoin price overlays
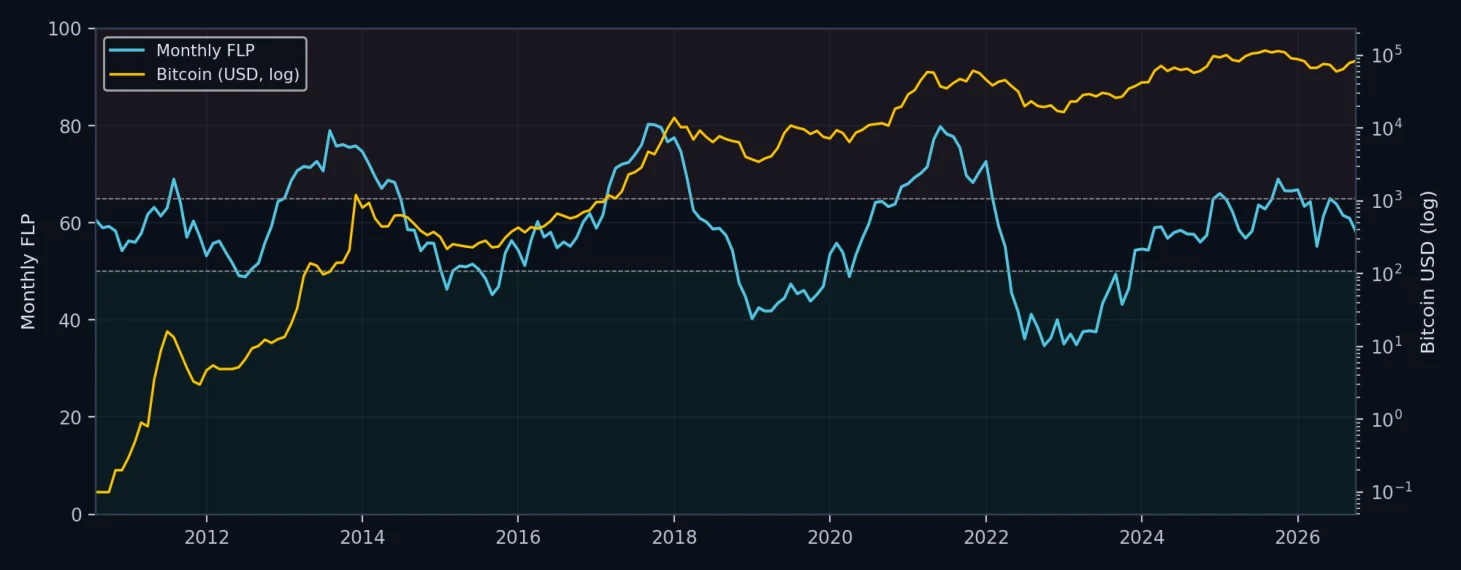
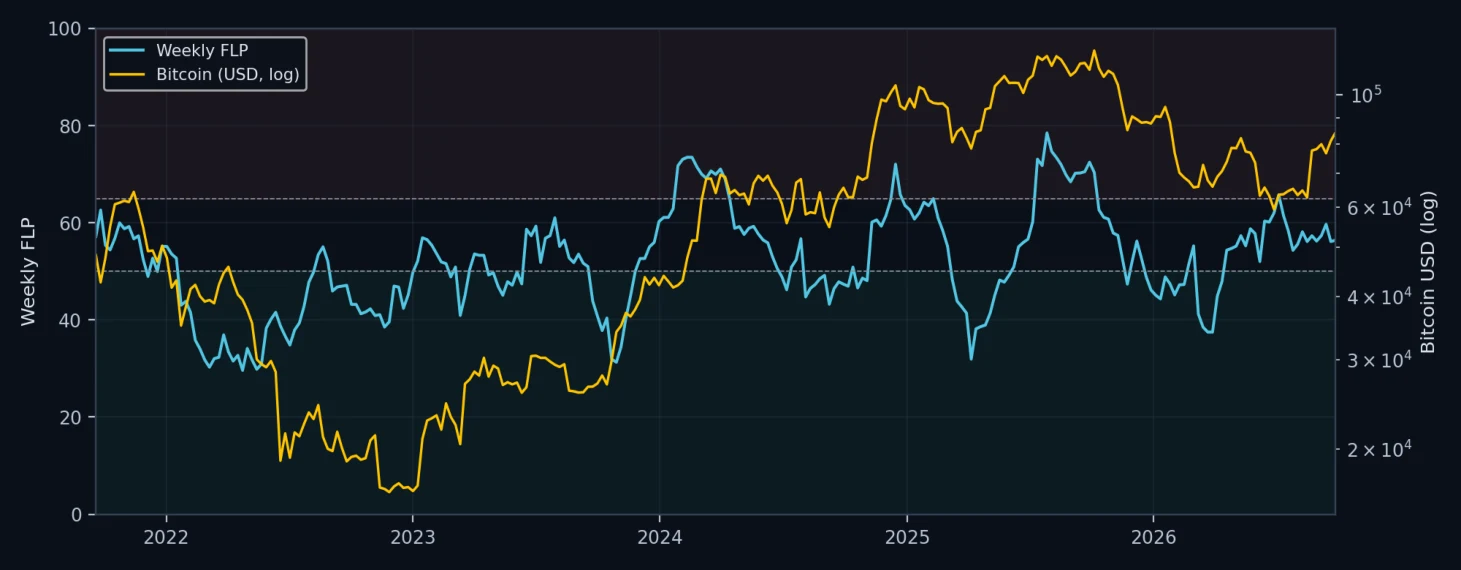
FLP: left axis, 0–100. Bitcoin: right axis, USD logarithmic scale. No timing shift applied. Regime guides: Favorable below 50; Transitional 50 to below 65; Defensive 65 and above.
3. Global Economy
TLP standardized z-score and composite level
| Measure | Reading |
|---|---|
| Latest TLP z-score | -0.8242 |
| TLP composite score | 54.48 |
| Latest month | 2026-10 |
| 1M z-delta | -0.4365 |
| 3M z-delta | -0.7301 |
| 1M composite delta | +0.04 |
| 3M composite delta | -2.80 |
TLP is shown in two forms: the standardized z-score and the composite level. The composite provides the framework’s level-based TLP reading alongside the normalized z-score. Percentage changes are intentionally omitted for the z-score because it is already standardized around its own distribution.
Global Business Cycle Summary
| Measure | Reading |
|---|---|
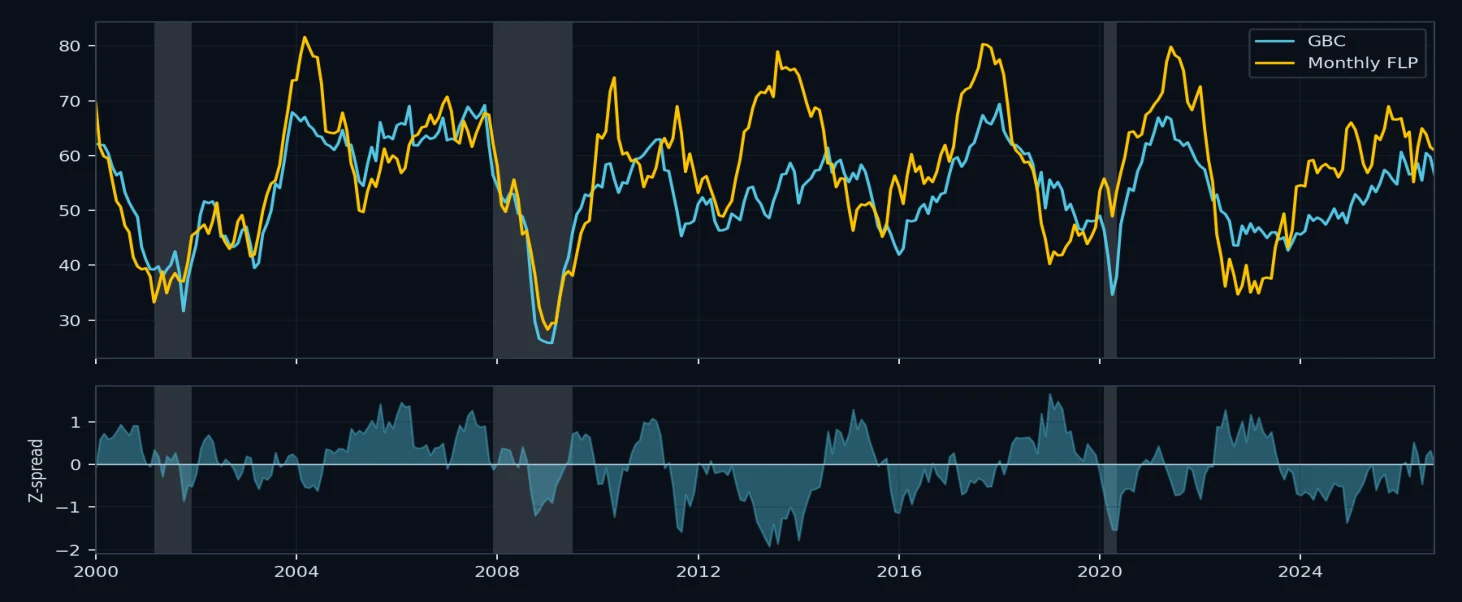
| Latest GBC | 56.54 |
| Current regime | Expansion |
| Latest date | 2026-09-01 |
| 1M point change | -3.18 |
| 3M point change | +1.09 |
| 3M % change | +1.97% |
GBC is a GDP-weighted composite of available normalized country business-cycle inputs. GBC uses its own regime scale — Expansion above 52, Neutral from 48 to 52, and Contraction below 48. Current regime: Expansion.
3.1 Global Economy — GBC vs Monthly FLP
Comparative chart of GBC composite versus published Monthly FLP
3.2 Global Economy — Macro Highlights
Working sections only — unavailable sections noted
| Section | Latest Value | Status | Date | Summary |
|---|---|---|---|---|
| Monthly FLP | 58.13 | Available | 2026-10-01 | Monthly FLP 58.13 (Transitional) as of 2026-10 |
| US PMI | 54.50 | Available | 2026-09-01 | PMI: 54.5 (working-sheet input) |
| Asia PMI Proxy | 47.87 | Available | 2026-10-01 | Trade Liquidity proxy: 47.87 (2026-10-01) |
| US 10Y vs Bund Spread | 1.71 pp | Available | 2026-09-30 | US10Y: 5.29% / Bund: 3.58% |
| SPY 1Y / 4Y Change Sum | +19.62% (1Y) | Available | 2026-09-27 | Weekly change sums: 1Y +19.62% / 4Y +76.54% / Spread: +56.92 pp |
| CPI vs Fed Funds Rate | 3.40% YoY CPI | Available | 2026-08-01 | CPI YoY: 3.40% / Target midpoint: 3.875% / Midpoint less CPI gap: +0.48 pp |
4. Forward Global Funding Conditions
GFC forward spread, asset response, and regime state
| Measure | Reading |
|---|---|
| Current backdrop | All four assets in Expansion; no active blowouts |
| Latest weekly date | 2026-09-27 |
| Section | Status | Summary |
|---|---|---|
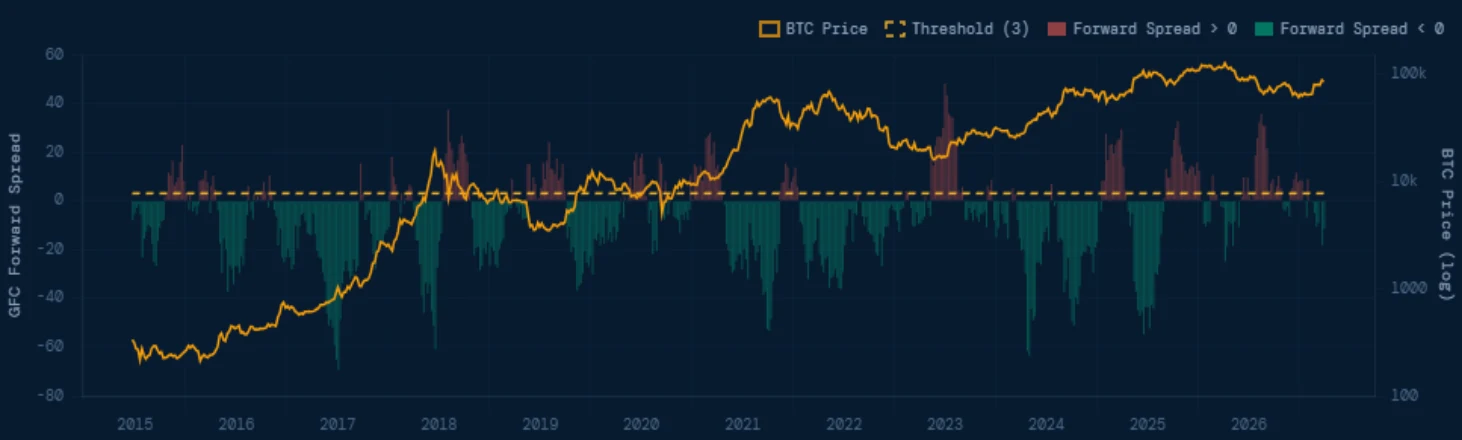
| GFC Forward Spread | Available | Same-week GFC minus asset momentum; lead overlays +13W |
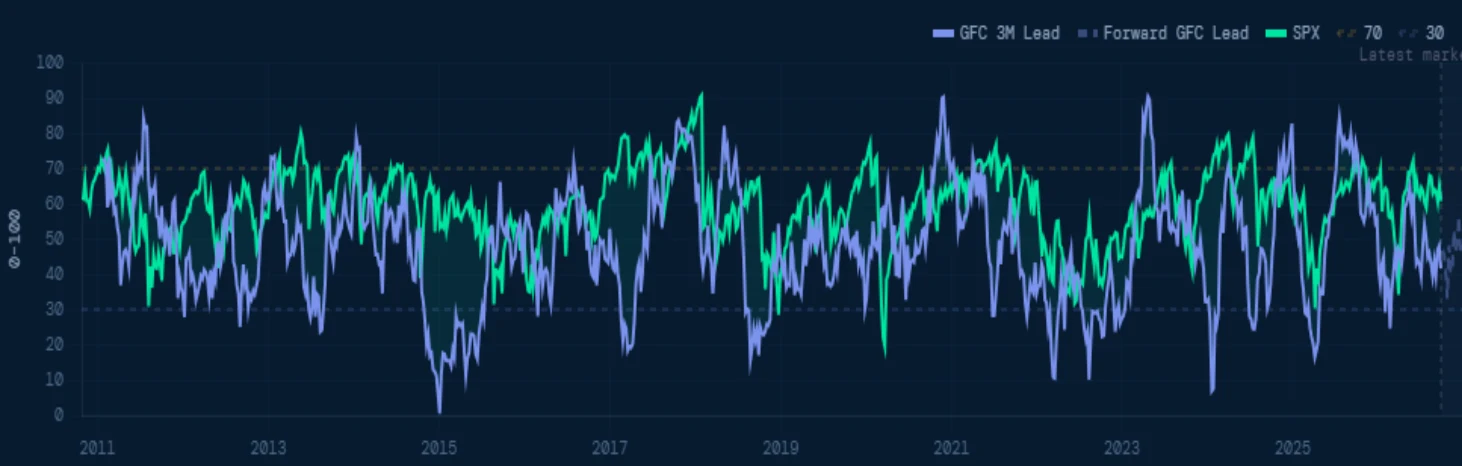
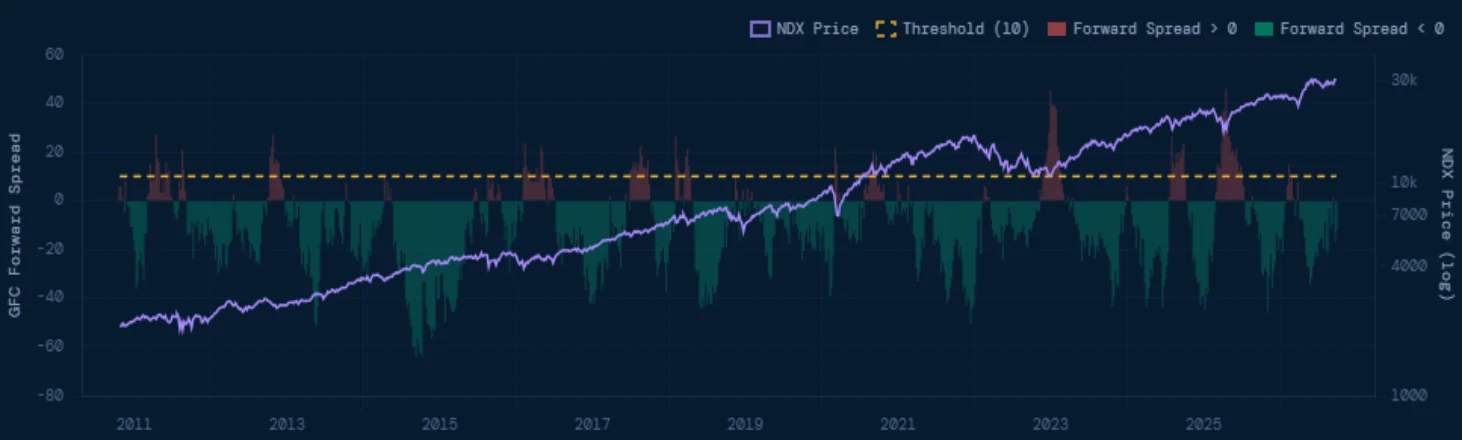
| SPX / NDX / BTC / ETH Response | Available | SPX: -12.42; NDX: -12.24; BTC: -11.48; ETH: -14.17. All four: Expansion. |
| Regime Signal Table | Available | Blowout thresholds: SPX 14.5 / NDX 10 / BTC 3 / ETH 10 |
4.1 Forward Global Funding Conditions
SPX lead alignment and NDX forward-spread view
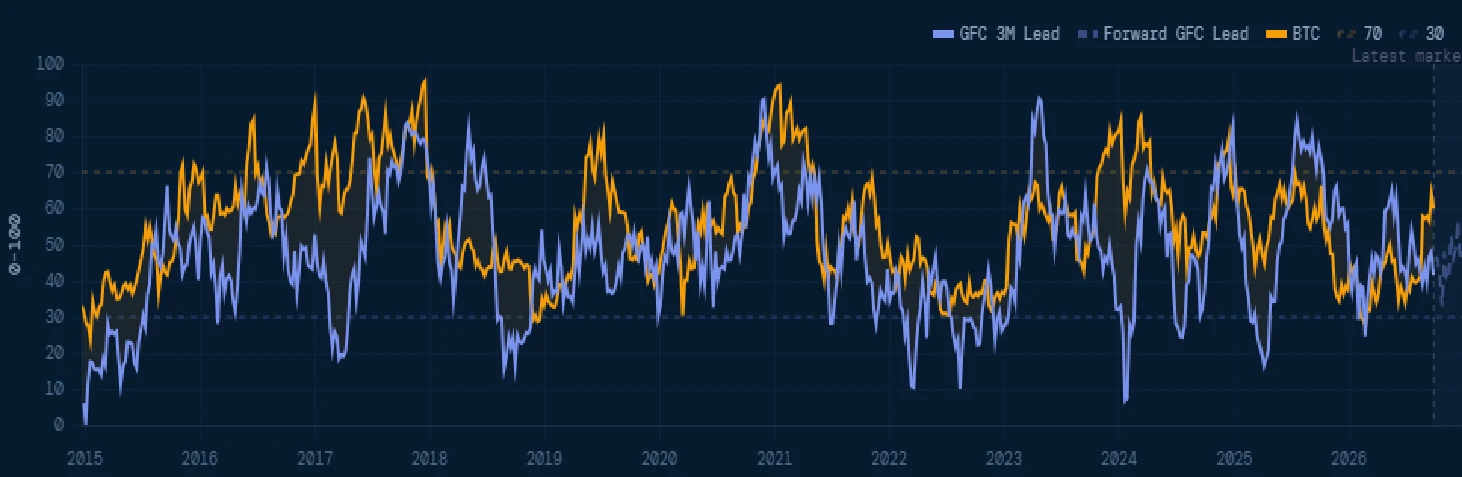
4.2 Forward Global Funding Conditions
BTC lead alignment and BTC forward-spread view
5. Crypto
Latest market snapshot at report publication
| Measure | Reading |
|---|---|
| BTC price | $83,635.35 |
| ETH price | $2,683.92 |
| Fear & Greed | 72 — Greed |
Market & Liquidity
| Section | Status | Latest Date | Notes |
|---|---|---|---|
| BTC Price | Available | 2026-10-01 | $83,635.35 |
| ETH Price | Available | 2026-10-01 | $2,683.92 |
| Estimated BTC TX Volume (USD) | Available | 2026-10-04 | $7.53B |
| Fear & Greed Index | Available | 2026-09-27 | 72 — Greed |
On-Chain & Regime
| Section | Status | Latest Date | Notes |
|---|---|---|---|
| Bitcoin Mining Conditions | Available | 2025-01-01 | BMI: 18.00 (2025) |
| Network Fundamentals | Available | 2026-10-04 | Hash rate: 930.51 EH/s · Est. TX volume: $7.53B |
| Bitcoin Network Regime | Available | 2026-10-04 | 56 / Neutral / 2 active stress flags |
Network snapshot: October 4, 2026, 8:37 PM EDT; latest weekly history: September 28. Price observations are October monthly opens; sentiment is dated September 27.
6. Bitcoin Mining
Annual BMI data plus current on-chain regime snapshot
| Measure | Reading |
|---|---|
| BMI value | 18.00 |
| Year | 2025 |
| Latest date | 2025 annual |
Bitcoin Network Regime Snapshot
Composite Network Regime: 56 / Neutral. As of Oct 4, 2026.
Percentile-ranked across 12 metrics across 8 categories · Higher = more expansionary
| Measure | Regime / State | Score |
|---|---|---|
| Composite Regime | Neutral | 56/100 |
| Security | Contracting | 49/100 |
| Mining Conditions | Expansionary | 83/100 |
| Fee Regime | Contracting | 45/100 |
| Settlement | Stress | 13/100 |
| Network Activity | Expansionary | 94/100 |
| UTXO Health | Expansionary | 87/100 |
| Adoption | Neutral | 67/100 |
| Network Expansion | Contracting | 34/100 |
| Active Stress Flags | 2 Active | Difficulty / Congestion |
Selected On-Chain Metrics
| Metric | Current | 4W ∆ | 52W ∆ | Percentile | Regime |
|---|---|---|---|---|---|
| Hash Rate | 930.51 | +1.9% | -20.3% | 94th | Expansionary |
| Mining Difficulty | 132.76 | +5.5% | -6.7% | 96th | Expansionary |
| Miner Revenue | $37.33M | -4.6% | -24.0% | 83rd | Expansionary |
| Daily Fee Revenue | $278.8K | +34.0% | -39.8% | 61st | Neutral |
| Mempool Size | 42.8MB | +63.0% | +10702.1% | 72nd | Neutral |
| Median Confirmation Time | 12.0 | +4.4% | +2778.0% | 87th | Expansionary |
| Avg Block Size | 1.59 | -1.0% | +5.0% | 88th | Expansionary |
| Daily TX Count | 594K | -4.0% | +41.7% | 95th | Expansionary |
| Estimated BTC TX Volume (USD) | $7.53B | -19.0% | +66.0% | 92nd | Expansionary |
| UTXO Set Size | 166.34M | -0.3% | -1.1% | 87th | Expansionary |
| Output Volume | 656K | -3.6% | -25.5% | 34th | Contracting |
Snapshot: Oct 4, 2026, 8:37 PM EDT. Stress flags: Extreme Difficulty and Network Congestion. Metric percentiles and labels reproduce the site; category scores adjust for stress direction. BMI is annual, through 2025. Active Addresses, included in the composite: 536K; 4W +19.8%; 52W -1.2%; 67th percentile, Neutral.
7. Methodology & Disclaimer
Monthly FLP Methodology
Monthly FLP is the published, locked monthly regime reading derived from the canonical monthly series. It reflects finalized monthly FLP values and does not update intra-month. The regime classification is canonical: Favorable when FLP is below 50, Transitional when FLP is greater than or equal to 50 and below 65, and Defensive when FLP is greater than or equal to 65.
Global Business Cycle Regime Scale
The Global Business Cycle uses an independent regime scale: Expansion above 52, Neutral from 48 to 52, and Contraction below 48. GBC terminology should not be inferred from FLP thresholds.
Reporting Convention
This October report reviews September month-end with October monthly opens and dated weekly observations. GFC readings and charts follow the published on-site series. The network snapshot is dated October 4, 2026.
Report Scope
• This report summarizes data available through the Skylark Digital Assets platform as of the generation date.
• Only active institutional pages and validated published series are included. Deprecated sections are excluded from this report.
• No raw API responses, debug outputs, proprietary formula details, or internal cache structures are included in this report.
Important Disclosures
Skylark Digital Assets is a research and education platform. The information shown is not investment advice, not a recommendation to buy or sell any asset, and not a substitute for independent financial, legal, or tax advice.
Historical relationships, liquidity regimes, and macro-cycle structures are provided for research context only and do not imply deterministic market outcomes.
Skylark Digital Assets Institutional Intelligence Summary September 2026 Month-End · Generated Sat, 03 Oct 2026 (revised Oct 4)
GBC TERMINOLOGY UPDATE
Beginning with this September 2026 month-end report, GBC labels are standardized to Expansion / Neutral / Contraction. Earlier reports used Favorable / Transitional / Defensive at the same >52 / 48-52 / <48 thresholds; the underlying series and cutoffs are unchanged.
SELECTED SOURCES - EXECUTIVE SUMMARY
[3] Congressional Budget Office - Monthly Budget Review: Summary for Fiscal Year 2022, Nov. 8, 2022.
[5] OpenAI - Announcing The Stargate Project, Jan. 21, 2025.
By Michael Pierre. Republished with permission from Skylark Digital Assets. Visit The Skylark Framework or read the original report (PDF).
More Articles About Bitcoin
The State of Bitcoin-Backed Lending, Q3 2026: A Smaller Market With Better Habits
Crypto lending shrank to $56.16B in Q2 with no blowups. How Coinbase, Arch, Strike, Ledn and Unchained compare on rate, LTV, custody and transparency....
October 7, 2026
FinCEN Withdraws Unhosted Wallet Rule and Crypto Mixer Proposal
FinCEN withdrew its 2020 unhosted wallet proposal, which would have required reports on self-custody crypto transactions over $10,000, plus a 2023 mix...
October 5, 2026
CFTC Opens Comment on Federal Rules for Leveraged Crypto Trading
The CFTC published an advance notice on federal rules for leveraged retail crypto trading, Regulation CTX and CAM. Comments run 60 days after publicat...
October 5, 2026
Podcast Conversations About Bitcoin


