
- Bitcoin
- Liquidity
- Macroeconomics
- Institutional Research
21Rates editor’s note: Michael Pierre approved public republication of this report and its charts. The original PDF retains its “Restricted Distribution” cover label. This is the August 2026 month-end report, originally published September 6, 2026; its readings are historical, not current market quotes. The report’s wording, section numbering, charts, and disclosures are preserved below, with tables reformatted for the web.
Read or download the original 13-page SkylarkOS report (PDF).
Monthly liquidity, FLI/TLP, global cycle, funding, and crypto market review
| Measure | Reading |
|---|---|
| Reporting Period | August 2026 Month-End |
| Data Through | September 1, 2026 Monthly Open |
| Published | September 6, 2026 |
| Original classification | Institutional — Restricted Distribution |
Reporting Convention: This month-end report reviews the completed August period while incorporating the first monthly-open observations available immediately after month-end, together with the latest validated weekly and market data available at publication.
SkylarkOS is a research and education platform. The information shown is not investment advice, not a recommendation to buy or sell any asset, and not a substitute for independent financial, legal, or tax advice.
Historical relationships, liquidity regimes, and macro-cycle structures are provided for research context only and do not imply deterministic market outcomes.
2. Executive Summary
Key intelligence for August 2026 month-end
- Monthly FLP score of 60.92 indicates a Transitional liquidity regime (8 monthly observations; 217 elapsed calendar days from the Feb. 1 regime start through publication).
- Weekly FLP is 56.23 in a Transitional regime, with a -1.10 point 1-week change and -1.54 point 13-week change.
- 3-month Monthly FLP delta: -6.2% (-4.03 points).
- Monthly FLI 4,795,017.00 (+3.68% 3M) / Weekly FLI 8,922.41 (+11.35% 13W).
- TLP Z-score -0.3880 (3M Δ -0.7740) / TLP Composite 54.44.
- GBC 60.36 [Favorable].
- Global Funding Conditions: All assets in Expansion — no stress signals.
- BTC at $79,837.26 / ETH at $2,499.09 / Est. BTC TX Vol: $9.29B.
- Bitcoin Network Regime: 58 [Neutral] with 2 active stress flags.
- All active report sections have available data this month.
3. FLP Regime Summary
Published monthly and weekly liquidity regime views
Published Monthly FLP
| Measure | Reading |
|---|---|
| Monthly FLP score | 60.92 |
| Regime | Transitional |
| Latest data date | 2026-09-01 |
| Data status | Healthy |
| 1-month point change | -0.61 |
| 3-month point change | -4.03 |
| 3-month % change | -6.2% |
| Days in regime (as of publication) | 217 |
| Distance to next threshold | 4.08 |
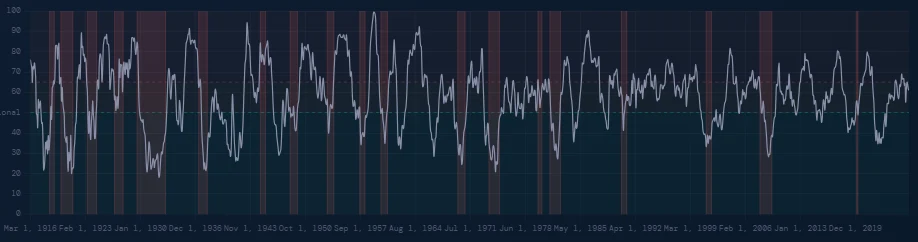
Monthly FLP is the published, locked monthly regime reading derived from the canonical monthly series. It reflects finalized monthly FLP values and does not update intra-month. The current Transitional run began on 2026-02-01; the 217-day duration is measured through the 2026-09-06 publication date. The regime classification is canonical: Favorable when FLP is below 50, Transitional when FLP is greater than or equal to 50 and below 65, and Defensive when FLP is greater than or equal to 65.
Weekly FLP Summary
Higher-resolution tactical liquidity regime view
| Measure | Reading |
|---|---|
| Weekly FLP | 56.23 |
| Regime | Transitional |
| Latest week | 2026-08-30 |
| 1-week point change | -1.10 |
| 13-week point change | -1.54 |
| 13-week % change | -2.67% |
Financial Liquidity Index Summary
Monthly and Weekly FLI
| Measure | Reading |
|---|---|
| Monthly FLI | 4,795,017.00 |
| Monthly date | 2026-09-01 |
| Monthly 1M point change | +51,787 |
| Monthly 3M point change | +170,099 |
| Monthly 3M % change | +3.68% |
| Weekly FLI | 8,922.41 |
| Weekly date | 2026-08-30 |
| Weekly 1W point change | +55.31 |
| Weekly 13W point change | +909.21 |
| Weekly 13W % change | +11.35% |
Monthly FLI provides the structural liquidity-index view, while Weekly FLI provides the higher-resolution tactical liquidity-index view. Both readings use the published FLI series.
3.1 Monthly FLP Historical Chart
Long-term published FLP context with recession overlays
4. True Liquidity Proxy & Global Business Cycle
TLP standardized z-score and composite level
| Measure | Reading |
|---|---|
| Latest TLP z-score | -0.3880 |
| TLP composite score | 54.44 |
| Latest month | 2026-09 |
| 1M z-delta | -0.2180 |
| 3M z-delta | -0.7740 |
| 1M composite delta | -5.30 |
| 3M composite delta | -5.76 |
TLP is shown in two forms: the standardized z-score and the composite level. The composite provides the framework’s level-based TLP reading alongside the normalized z-score. Percentage changes are intentionally omitted for the z-score because it is already standardized around its own distribution.
Global Business Cycle Summary
| Measure | Reading |
|---|---|
| Latest GBC | 60.36 |
| Current regime | Favorable |
| Latest date | 2026-08-01 |
| 1M point change | -0.47 |
| 3M point change | -0.05 |
| 3M % change | -0.08% |
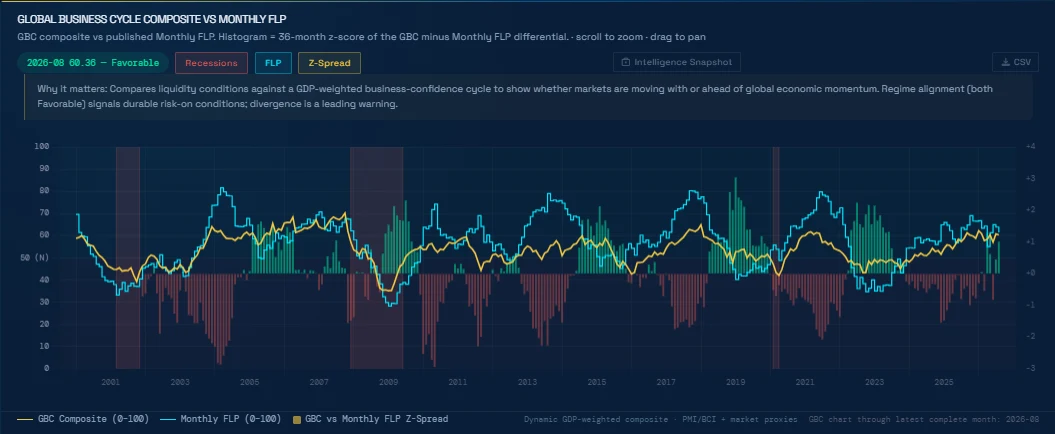
GBC monitors the real-economic growth cycle using US PMI, GDP growth, Asia PMI proxy signals, and leading indicators. GBC uses its own regime scale — Favorable above 52, Transitional from 48 to 52, and Defensive below 48. Current regime: Favorable.
4.1 Global Business Cycle vs Monthly FLP
Comparative chart of GBC composite versus published Monthly FLP
7. Macro Command Center Highlights
Working sections only — unavailable sections noted
| Section | Latest Value | Status | Date | Summary |
|---|---|---|---|---|
| Monthly FLP | 60.92 | Available | 2026-09-01 | Monthly FLP 60.92 (Transitional) as of 2026-09 |
| US PMI | 54.60 | Available | 2026-08-01 | PMI: 54.6 |
| Asia PMI Proxy | 53.89 | Available | 2026-09-01 | Trade Liquidity proxy: 53.89 (2026-09-01) |
| US 10Y vs Bund Spread | 1.42% | Available | 2026-09-04 | US10Y: 4.78% / Bund: 3.36% |
| SPY 1Y / 4Y Return | +18.65% (1Y) | Available | 2026-09-04 | SPY 1Y gain: +18.65% / 4Y gain: +96.36% / Spread: +77.71 pp |
| CPI vs Fed Funds Rate | 3.40% YoY CPI | Available | 2026-07-01 | CPI YoY: 3.40% / Fed Funds: 3.63% / Real policy rate: +0.23% |
8. Global Funding Conditions Summary
GFC forward spread, asset response, and regime state
| Measure | Reading |
|---|---|
| Current backdrop | All assets in Expansion — no stress signals |
| Latest weekly date | 2026-08-30 |
| Section | Status | Summary |
|---|---|---|
| 3-Month Lead Spread | Available | GFC 13-week forward spread computed — 4 assets |
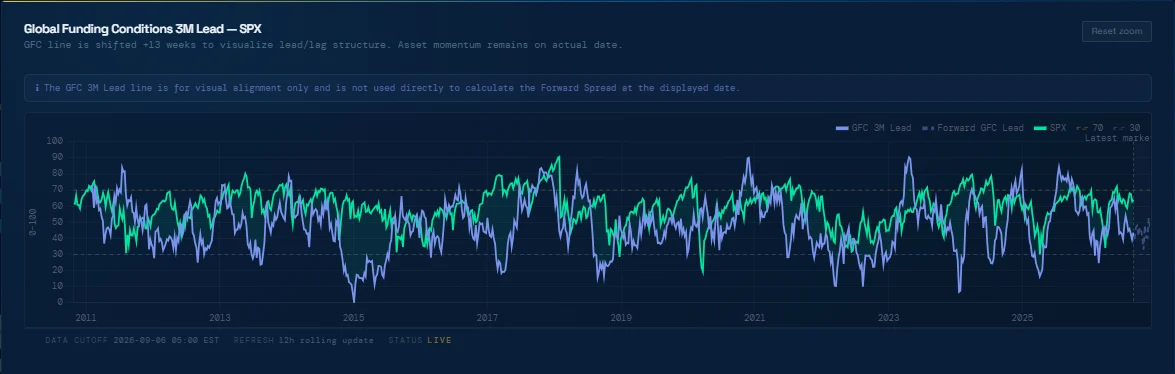
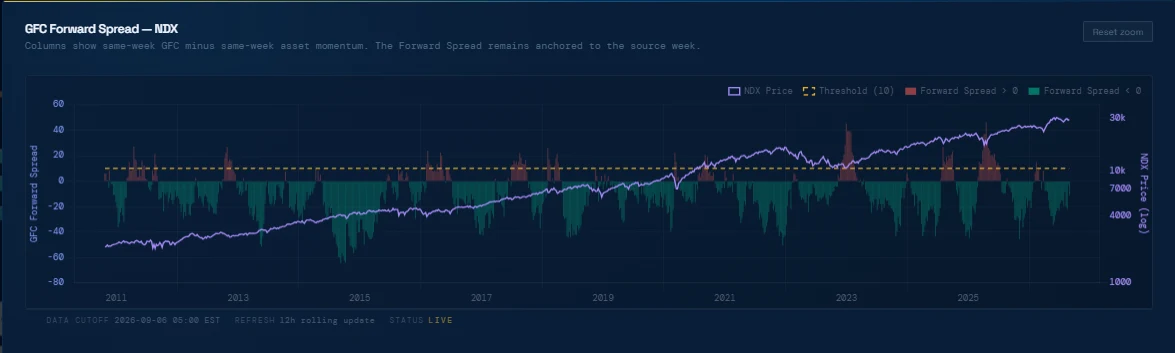
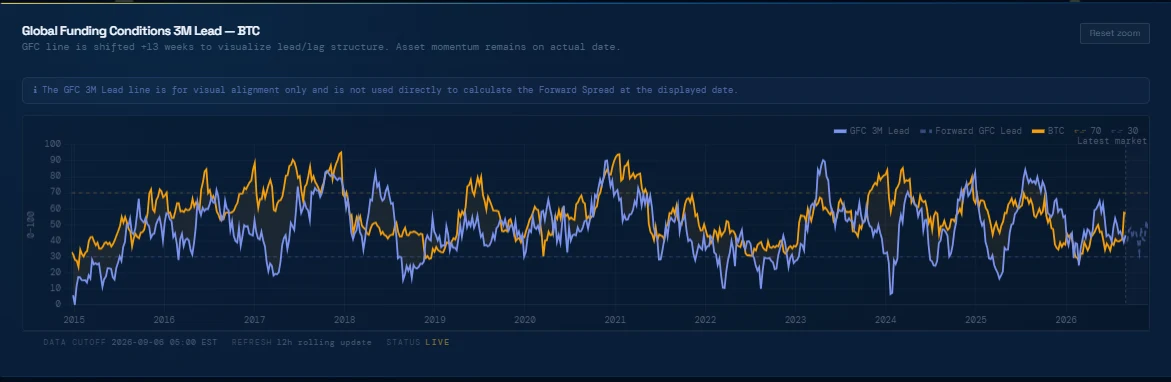
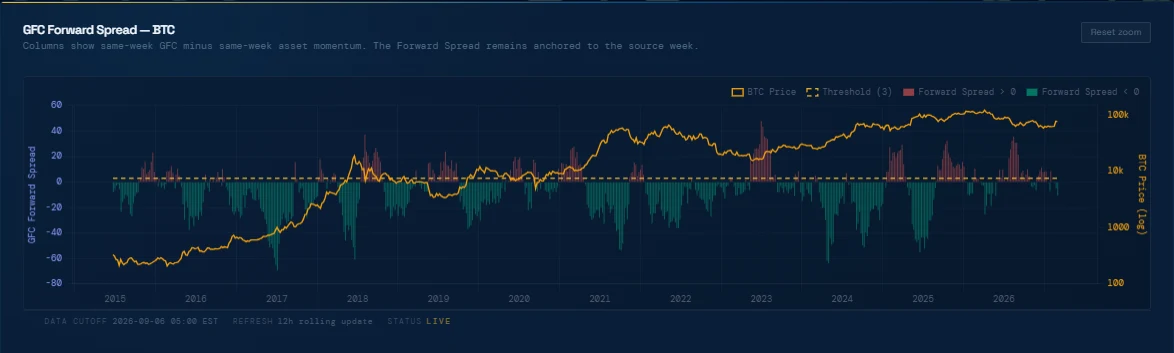
| SPX / NDX / BTC / ETH Response | Available | SPX: -17.34 (Expansion), NDX: -11.09 (Expansion), BTC: -10.49 (Expansion), ETH: -12.09 (Expansion) |
| Regime Signal Table | Available | 4 assets tracked |
8.1 Global Funding Conditions Charts
SPX lead alignment and NDX forward-spread view
8.2 Global Funding Conditions Charts
BTC lead alignment and BTC forward-spread view
9. Crypto Liquidity Command Center
Latest market snapshot at report publication
| Measure | Reading |
|---|---|
| BTC price | $79,837.26 |
| ETH price | $2,499.09 |
| Fear & Greed | 73 — Greed |
Market & Liquidity
| Section | Status | Latest Date | Notes |
|---|---|---|---|
| BTC Price | Available | 2026-09-06 | $79,837.258 |
| ETH Price | Available | 2026-09-06 | $2,499.09 |
| Estimated BTC TX Volume (USD) | Available | 2026-09-05 | $9.29B |
| Fear & Greed Index | Available | 2026-09-06 | 73 — Greed |
On-Chain & Regime
| Section | Status | Latest Date | Notes |
|---|---|---|---|
| Bitcoin Mining Conditions | Available | 2025-01-01 | BMI: 18.00 (2025) |
| Network Fundamentals | Available | 2026-09-05 | Hash rate: 927.54 EH/s · Est. TX volume: $9.29B |
| Bitcoin Network Regime | Available | 2026-09-06 | Composite score: 58 / Regime: Neutral / Stress flags: 2 |
Network Fundamentals and Bitcoin Network Regime are latest-available snapshots captured after the August period close and included here because this month-end report is published after the close with September monthly-open data.
10. Bitcoin Mining Index & Network Regime
Annual BMI data plus current on-chain regime snapshot
| Measure | Reading |
|---|---|
| BMI value | 18.00 |
| Year | 2025 |
| Latest date | 2025-01-01 |
Bitcoin Network Regime Snapshot
Composite Network Regime: 58 — Neutral. As of Sep 6, 2026, 04:00 AM.
Percentile-ranked across 12 metrics across 8 categories · Higher = more expansionary
| Measure | Regime / State | Score |
|---|---|---|
| Composite Regime | Neutral | 58/100 |
| Security | Neutral | 51/100 |
| Mining Conditions | Expansionary | 86/100 |
| Fee Regime | Neutral | 52/100 |
| Settlement | Stress | 10/100 |
| Network Activity | Expansionary | 97/100 |
| UTXO Health | Expansionary | 89/100 |
| Adoption | Neutral | 67/100 |
| Network Expansion | Contracting | 36/100 |
| Active Stress Flags | 2 Active | 2/100 |
Selected On-Chain Metrics
| Metric | Current | 1W Δ | 3M Δ | Percentile | Regime |
|---|---|---|---|---|---|
| Hash Rate | 927.54 | -9.9% | +2.8% | 95th | EXPANSIONARY |
| Mining Difficulty | 126.07 | -0.1% | -2.8% | 94th | EXPANSIONARY |
| Miner Revenue | $39.75M | +14.3% | -32.0% | 86th | EXPANSIONARY |
| Daily Fee Revenue | $287.4K | -27.2% | -26.2% | 62nd | NEUTRAL |
| Mempool Size | 12.7MB | -44.0% | +4901.4% | 58th | NEUTRAL |
| Median Confirmation Time | 13.0 | +12.0% | +90.6% | 91st | EXPANSIONARY |
| Avg Block Size | 1.60 | +1.1% | +5.9% | 89th | EXPANSIONARY |
| Daily TX Count | 712K | +0.0% | +19.5% | 98th | EXPANSIONARY |
| Estimated BTC TX Volume (USD) | $9.29B | +36.9% | +100.7% | 96th | EXPANSIONARY |
| UTXO Set Size | 166.76M | -0.1% | -1.4% | 89th | EXPANSIONARY |
| Output Volume | 681K | +3.4% | -8.2% | 36th | CONTRACTING |
Stress flags currently active: Extreme Difficulty and Network Congestion. This section supplements the annual BMI framework with the current Bitcoin Network Regime view so mining conditions can be read alongside broader on-chain activity, settlement quality, and network-expansion behavior.
11. Institutional Platform Flash
Active pages — status across the institutional platform
| Institutional Page | Current Read / Primary Signal | Latest Date | Status | Flash Note |
|---|---|---|---|---|
| Monthly FLP / Liquidity Regime | 60.92 (Transitional) | 2026-09-01 | Available | 8 mo in current regime |
| Weekly FLP / Tactical Regime | 56.23 (Transitional) | 2026-08-30 | Available | 1W: -1.10 / 13W: -1.54 |
| FLI / Financial Liquidity Index (Weekly + Monthly) | M 4,795,017.00 / W 8,922.41 | M 2026-09-01 / W 2026-08-30 | Available | M 1M: +51,787 / W 13W: +909.21 |
| TLP / True Liquidity Proxy | Z -0.3880 / Composite 54.44 | 2026-09 | Available | 3M z Δ: -0.7740 |
| Global Business Cycle | 60.36 [Favorable] | 2026-08-01 | Available | Favorable |
| Global Funding Conditions | All assets in Expansion | 2026-08-30 | Available | 4 chart views added |
| Crypto Liquidity Command Center | BTC $79,837.26 / ETH $2,499.09 / Vol $9.29B | 2026-09-06 | Available | F&G 73 (Greed) |
| Bitcoin Mining Index / Network Regime | BMI 18.00 / Net 58 Neutral | 2026-09-06 | Available | 2 stress flags active |
| Macro Command Center | PMI 54.6 / Asia proxy 53.89 | 2026-09-01 | Available | Trade Liquidity used as Asia proxy |
12. Methodology & Disclaimer
Monthly FLP Methodology
Monthly FLP is the published, locked monthly regime reading derived from the canonical monthly series. It reflects finalized monthly FLP values and does not update intra-month. The regime classification is canonical: Favorable when FLP is below 50, Transitional when FLP is greater than or equal to 50 and below 65, and Defensive when FLP is greater than or equal to 65.
Global Business Cycle Regime Scale
The Global Business Cycle uses an independent regime scale: Favorable above 52, Transitional from 48 to 52, and Defensive below 48. GBC terminology should not be inferred from FLP thresholds.
Reporting Convention
This month-end report reviews the completed August period while incorporating the first monthly-open observations available immediately after month-end, together with the latest validated weekly and market data available at publication.
Report Scope
- This report summarizes data available through the SkylarkOS platform as of the generation date.
- Only active institutional pages and validated published series are included. Deprecated sections are excluded from this report.
- No raw API responses, debug outputs, proprietary formula details, or internal cache structures are included in this report.
Important Disclosures
SkylarkOS is a research and education platform. The information shown is not investment advice, not a recommendation to buy or sell any asset, and not a substitute for independent financial, legal, or tax advice.
Historical relationships, liquidity regimes, and macro-cycle structures are provided for research context only and do not imply deterministic market outcomes.
SkylarkOS Institutional Intelligence Summary · August 2026 Month-End · Generated Sun, 06 Sep 2026 07:55:00 GMT
By Michael Pierre. Republished with permission from SkylarkOS. Visit The Skylark Framework or read the original report (PDF).
More Articles About Bitcoin
Building a Digital Treasury with Commercial Real Estate
How Commercial Real Estate Can Become a Bitcoin Acquisition Engine...
September 29, 2026
Qualified Custody vs Collaborative Multisig for Bitcoin
Qualified custody delegates key holding and signing to a provider under a contract; collaborative multisig keeps you as one of several required signer...
September 28, 2026
Best Bitcoin IRAs in 2026: Fees, custody and self-custody compared
Best Bitcoin IRAs in 2026: Fees, custody and self-custody compared Five providers account for much of the Bitcoin IRA market in 2026, but they are bui...
August 26, 2026
Podcast Conversations About Bitcoin


